Guide
The Customer Who Costs You 50x More Than the Rest
AI usage varies by customer while the price they pay does not. Why the average hides your most expensive account, and the query that finds it.
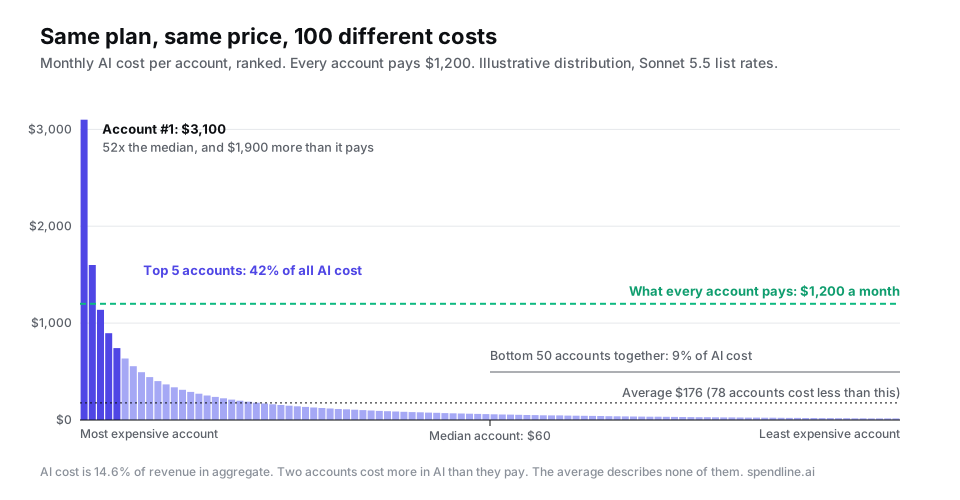
Take an illustrative product: 100 customer accounts, each paying the same $1,200 a month. The median account costs $60 a month in model usage. The heaviest costs $3,100, which is 52 times the median and $1,900 more than it pays. Total AI cost is a comfortable 14.6% of revenue, so nothing on the provider invoice or the company P&L points at that account. The figures are ours, built to show how the gap arises; how wide it is in your product only your own records can say.
Finding it takes one query, provided every model call carries a customer identifier. This guide covers why the gap is so wide, what the distribution looks like, how to measure your own, and what to do with the account at the top.
Why the average hides it
The usual first number is total AI spend divided by customer count. In the example that is $17,573 across 100 accounts, or $176 each. It sounds like a unit cost, and almost no customer has it: 78 of the 100 accounts cost less than $176, and the top two cost nine and eighteen times more.
The mean fails because the distribution is long-tailed. A handful of heavy accounts pull it upward, so it overstates what a typical customer costs and understates what the heavy ones cost. Price from it and you overcharge most accounts while losing money on the top few. The aggregate ratio repeats the error a level up: 14.6% AI cost against revenue looks healthy, and it is the blend of 98 accounts whose AI cost is below what they pay and two whose AI cost exceeds it. (That is margin after AI cost only. Hosting, support and other costs come off before full gross margin.)
Provider reports group usage by model, project or API key. Your application supplies the customer and workflow context needed to see cost per account. Per-customer cost only exists if you record it on your side of the call, a contract covered in how to track LLM costs per customer.
Where a 50x gap comes from
A customer's monthly AI cost is a product, not a sum:
monthly_cost = active_users
             x actions_per_user
             x model_calls_per_action
             x tokens_per_call
             x price_per_token
Each factor varies between accounts, and the variations multiply. A customer with twice the users, twice the activity per user and a workflow that makes ten calls instead of one costs forty times as much, while each difference looks unremarkable alone. Multiplied factors produce a long right tail almost by construction, which is why the shape in the chart is the normal case and not a freak. (That last point is our judgment from the arithmetic, not a measured industry statistic.)
Workflow mix can move cost sharply. Anthropic's engineering team reported that its agents use about 4x the tokens of a chat interaction and multi-agent systems about 15x, in its post on building a multi-agent research system. A customer who adopts your agentic feature moves into a different cost bracket while staying on the same plan.
The worked calculation
Both accounts below use Claude Sonnet 5.5 at its published rates of $2 per million input tokens and $10 per million output. Caching is left out to keep the arithmetic visible; it would lower both figures.
One chat action: 1 call, 8,000 input + 800 output tokens
  8,000 x $2  / 1M = $0.0160
    800 x $10 / 1M = $0.0080
  cost per action  = $0.024

One agent run: 12 calls, avg 30,000 input + 700 output tokens per call
  360,000 x $2  / 1M = $0.7200
    8,400 x $10 / 1M = $0.0840
  cost per run       = $0.804   (33.5x a chat action)

  Each call re-sends the conversation so far, so the run
  reads 360,000 input tokens against 8,000 for a chat action.

Median account: 10 users x 250 chat actions
  2,500 x $0.024              = $60.00

Heaviest account: 40 users x 250 chat actions, plus agent runs
  10,000 x $0.024             = $240.00
   3,560 x $0.804             = $2,862.24
  total                       = $3,102.24  (shown as $3,100 in the chart)
The heavy account has four times the users. It costs 52 times as much because it also uses the agent feature, and 92% of its bill comes from agent runs. A dashboard that tracks seats would rank it as a large customer, and it is one, but four times the revenue was never on the table. Both accounts pay $1,200.
Where fixed-price AI plans have run into trouble
The companies that sell AI on flat subscriptions have said so in public. In its July 2025 pricing clarification, Cursor wrote that while most users' costs stayed fairly constant, the hardest requests cost an order of magnitude more than simple ones, and it moved its individual plans from request limits to compute-based usage. Anthropic introduced weekly limits on its Claude subscriptions after some users ran Claude Code continuously in the background, around the clock, saying the limits would affect fewer than 5% of subscribers, as reported by TechCrunch. OpenAI's chief executive said the company was losing money on its $200-a-month ChatGPT Pro plan because subscribers used it more than expected (TechCrunch).
These cases show heavy usage straining flat prices. They do not tell you what your own distribution looks like; only your records can. A B2B product reselling these models on a per-seat or per-account price carries the same kind of exposure, usually with less visibility into it.
How to find yours
If each call is recorded with a server-set customer_id and its cost, the distribution is one query. This version returns four numbers: how far the top account sits from the median, the share of AI cost from the top five accounts, the share from the top 10% of accounts, and how many accounts cost more than half of what they pay.
WITH per_customer AS (
  SELECT customer_id, SUM(cost_usd) AS ai_cost
  FROM ai_calls
  WHERE created_at >= '2026-09-01' AND created_at < '2026-10-01'
  GROUP BY customer_id
),
ranked AS (
  SELECT p.*, r.revenue_usd,
         ROW_NUMBER() OVER (ORDER BY ai_cost DESC) AS rnk,
         COUNT(*) OVER () AS n
  FROM per_customer p
  JOIN monthly_revenue r USING (customer_id)
  WHERE r.month = '2026-09'
)
SELECT
  MAX(ai_cost) / PERCENTILE_CONT(0.5) WITHIN GROUP (ORDER BY ai_cost)
    AS top_to_median,
  SUM(ai_cost) FILTER (WHERE rnk <= 5) / SUM(ai_cost)
    AS top5_share,
  SUM(ai_cost) FILTER (WHERE rnk <= CEIL(n * 0.10)) / SUM(ai_cost)
    AS top10pct_share,
  COUNT(*) FILTER (WHERE ai_cost > 0.5 * revenue_usd)
    AS accounts_over_half_revenue
FROM ranked;
On the example data this returns 51.7 (top account to median), 0.425 (the top five accounts produce 42.5% of AI cost), 0.569 (the top 10%, here ten accounts, produce 56.9%) and 6. Then drop the aggregate and list the top ten accounts by name. The list does more work than the ratios, because someone in the room will know why each name is on it.
Two things make the numbers trustworthy. The customer identifier must be set by your server, since a client-supplied one is a spoofable billing input. And the records have to include all of your model traffic: a batch job or a new service that calls the provider directly is invisible here, and batch work is often among the heaviest. Turning these costs into margin per account, with the right revenue figure, is worked through in how to calculate AI gross margin by customer. To find your own outliers in a week, follow the one-week AI cost-to-serve audit.
If your calls do not carry a customer ID today, the query has nothing to run on, and provider reports cannot supply the missing customer afterwards. Newly instrumented traffic starts the record from the day the identifier is added; it describes the period it covers, not earlier months. Where your logs already hold customer IDs and token counts, those historical records can be analysed with the same query, and they are the only evidence about the past.
What the top account usually turns out to be
An expensive account is a question, not a verdict. There are a handful of common explanations, and each has a different fix.
| What the outlier is | How to recognize it | What to do |
|---|---|---|
| A defect | Cost jumped without a change in users or activity; one workflow or agent shows repeated near-identical calls | Fix the bug (retry loop, runaway agent, missing cache). No customer conversation needed |
| An expensive configuration | Same activity as peers, but on a larger model or with far longer context | Route that workload to a cheaper model or add prompt caching, then re-measure |
| Your best customer | Heavy, steady use of the feature you most want adopted | Price the usage: a tier, metered agent runs, or an included allowance with overage at renewal |
| Unintended use | Usage pattern no other account shows (scraping, bulk export through a chat surface) | Fair-use terms and a per-account limit |
| Simply larger | Cost scales with users, and revenue would too under seat pricing | Check that your plan structure lets revenue follow usage |
Only the third and fifth rows are pricing problems. The first two are engineering problems that look like pricing problems until someone opens the account's calls. Separating them needs the cost broken down by workflow and run within the account, which is why the workflow and run identifiers matter as much as customer_id. How a single run's cost is assembled is covered in what an AI agent run actually costs.
From finding to control
Once you can see the account, the next question is whether to stop it happening again. Some teams decide a heavy customer is worth the cost and change nothing but the renewal price. Others set a per-customer budget so that next month's equivalent of the $3,100 account is stopped or downgraded before the provider call, rather than discovered afterwards. Agree in advance what happens when a limit is reached: for a valuable paying customer the right response is often a conversation, not a block. The options at the cap, and the trap where concurrent requests all pass the same check, are in LLM budget enforcement.
Finance comes later and needs the same records. If per-customer cost is going to inform pricing, finance has to trust that the ledger adds up to the provider invoice each month, so the per-customer view and the month-end total must come from one set of call records rather than two systems that disagree. Survey averages for where AI gross margins sit today are collected in what AI did to software gross margins.
Common failure modes
- Pricing from the mean. A per-customer cost assumption built on the average overstates the typical account and badly understates the heavy one.
- Seats as a cost proxy. Seat count is one factor of five. The account with four times the seats in the example costs 52 times as much.
- Monthly totals only. A month-level number per customer hides whether the cost came from one runaway day or steady use, and those need opposite responses.
- Attribution with gaps. Calls with no customer identifier land in an unattributed pool. If that pool is large, the long tail may be sitting inside it.
- Treating the outlier as a pricing problem first. Some of the most expensive accounts are bugs. Check for repeated calls before calling sales.
How Spendline does this
Spendline routes supported AI requests, records attributed costs and applies configured controls. Change a supported route's base URL and send x-customer-id (and optionally x-workflow-id and x-agent-id) with each request, set on your server from authenticated request context. Spendline records the supplied customer ID and server time with each routed call and prices it, so the ranked view in this guide comes from records for that traffic. Calls sent directly to a provider are not included. Where you share revenue data, Spendline compares each customer's revenue with attributed AI cost over the same period; other delivery costs are not included. If you decide an account needs a limit, a customer-scoped budget uses the same identifier.
FAQ
Why does AI cost vary so much between customers on the same plan? Per-customer cost is a product of users, actions per user, workflow, calls per action and tokens per call. Modest differences in each multiply, so a heavy agentic user can cost fifty times the median while paying the same price.
Why is the average AI cost per customer misleading? A few heavy accounts pull the mean far above the typical account. In the example the average is $176, the median $60, and 78 of 100 accounts cost less than the average.
How do I find which customers cost the most in AI? Record each call with a server-set customer identifier and its cost, group by customer for a month, sort descending, and compare the top account to the median and the top five to the total.
Should I drop a customer who costs more in AI than they pay? Rarely, and never first. Rule out a defect, then a cheaper configuration, then treat real and valuable usage as a pricing conversation at renewal.
What metrics show AI cost concentration across customers? The top-to-median ratio, the share of cost from the top five or top ten percent of accounts, and the count of accounts whose AI cost exceeds a set fraction of their revenue. Track them monthly.
Sources and method
Written by the Spendline team, with public sources checked on 4 October 2026: model rates from Anthropic's published price list; the 4x and 15x token multiples from Anthropic's multi-agent engineering post; the order-of-magnitude cost spread between requests from Cursor's pricing clarification; the Claude subscription limits and the fewer-than-5% figure from TechCrunch, 28 July 2025; the ChatGPT Pro statement from TechCrunch, 5 January 2025. The 100-account distribution is illustrative, not customer data: it is a log-normal curve with a $15 floor, scaled so the median is $60 and the top account $3,100, and every statistic quoted from it is computed from those 100 values. The outlier categories are our judgment. Prices change without notice, so check them before relying on a figure. Last updated: October 2026.
See what this would look like in your product.
Start with a guided 30-day free pilot on live production traffic. The 30 days start when your traffic flows through Spendline, not at sign-up. We agree the scope, success criteria and paid terms before you start. There is no Spendline subscription fee during the pilot; your model-provider charges still apply.
Prefer email? fida@spendline.ai